


.svg)


New
Announcing our European expansion to help enterprises scale AI with data sovereignty. Read the news →
Platform Overview

Data & AI Observability
Agentic Data Engineering
Data Warehousing
Agentic Runtime
Agentic Data Management
Hadoop Modernization
Platform Overview
Everything you need to build, govern, and scale data and AI workloads—one unified platform.
xLake Architecture
Manage your data estate under one platform
Explore Integrations


Data & AI Observability
Monitor, detect, and resolve data and AI issues with end-to-end observability across pipelines.
Explore
Agentic Data Engineering
Build, orchestrate, and run data pipelines with intelligent agents that automate the entire engineering workflow.
Explore ADE
Data Warehousing
Query your lakehouse in-place with Velox-accelerated performance. 10x faster than traditional warehouses.
Explore Data Warehousing
CAPABILITIES


Agentic Runtime
Distributed training, high-throughput inference, and GPU notebooks—everything you need for production AI.
Explore
CAPABILITIES


Agentic Data Management
Build, deploy, and manage intelligent agents to automate and optimize data operations.
Explore ADM

Industries
Browse solutions to help you solve the complex business challenges unique to your industry.
Explore Case Studies
Resources
Browse materials to help you access the tools, guides, and insights essential to your workflows.


Company
Learn about our mission, leadership, and vision driving modern data operations forward.


Products

Industry
Resources
Company

Back
Platform Overview
Data & AI Observability
Agentic Data Management
Agentic Data Engineering
Data Warehousing
Data Science
Data Platform Modernization
Back
Industries
Browse solutions to help you solve the complex business challenges unique to your industry.
Explore Case Studies
Back
Resources
Browse materials to help you access the tools, guides, and insights essential to your workflows.
Back
Company
Learn about our mission, leadership, and vision driving modern data operations forward.
Back
Platform Overview
Everything you need to build, govern, and scale data and AI workloads—one unified platform.
xLake Architecture
Manage your data estate under one platform
Explore Integrations
Back
Data & AI Observability
Monitor, detect, and resolve data and AI issues with end-to-end observability across pipelines.
Explore
Back
Agentic Data Management
Build, deploy, and manage intelligent agents to automate and optimize data operations.
Explore ADM
Back
Agentic Data Engineering
Build, orchestrate, and run data pipelines with intelligent agents that automate the entire engineering workflow.
Explore ADE
Back
Data Warehousing
Query your lakehouse in-place with Velox-accelerated performance. 10x faster than traditional warehouses.
Explore Data Warehousing
CAPABILITIES
Back
Agentic Runtime
Distributed training, high-throughput inference, and GPU notebooks—everything you need for production AI.
Explore
CAPABILITIES
Products
Platform Overview
Data & AI Observability
Agentic Data Management
Agentic Data Engineering
Data Warehousing
ML & AI Applications
Business Applications
Data Platform Modernization
Platform Overview
Lorem ipsum dolor sit amet, consectetur adipiscing elit. Suspendisse sollicitudin mi
Explore Platform
Data & AI Observability
Monitor, detect, and resolve data issues with end-to-end observability across pipelines.
Explore ADOC
Agentic Data Management
Monitor, detect, and resolve data issues with end-to-end observability across pipelines.
Explore ADM
Agentic Data Engineering
Lorem ipsum dolor sit amet, consectetur adipiscing elit. Suspendisse sollicitudin mi nibh
Explore ADE
Data Warehousing
AI-powered observability and optimization for Hadoop and big data environments.
Explore Data Warehousing


ML & AI Applications
Lorem ipsum dolor sit amet, consectetur adipiscing elit. Suspendisse sollicitudin
Explore ML & AI Applications


Data & AI Observability
Lorem ipsum dolor sit amet, consectetur adipiscing elit. Suspendisse so
Explore Business Applications
Open Data Platform
An open-source data platform for Hadoop modernization, flexibility, and long-term control.
Explore ODP
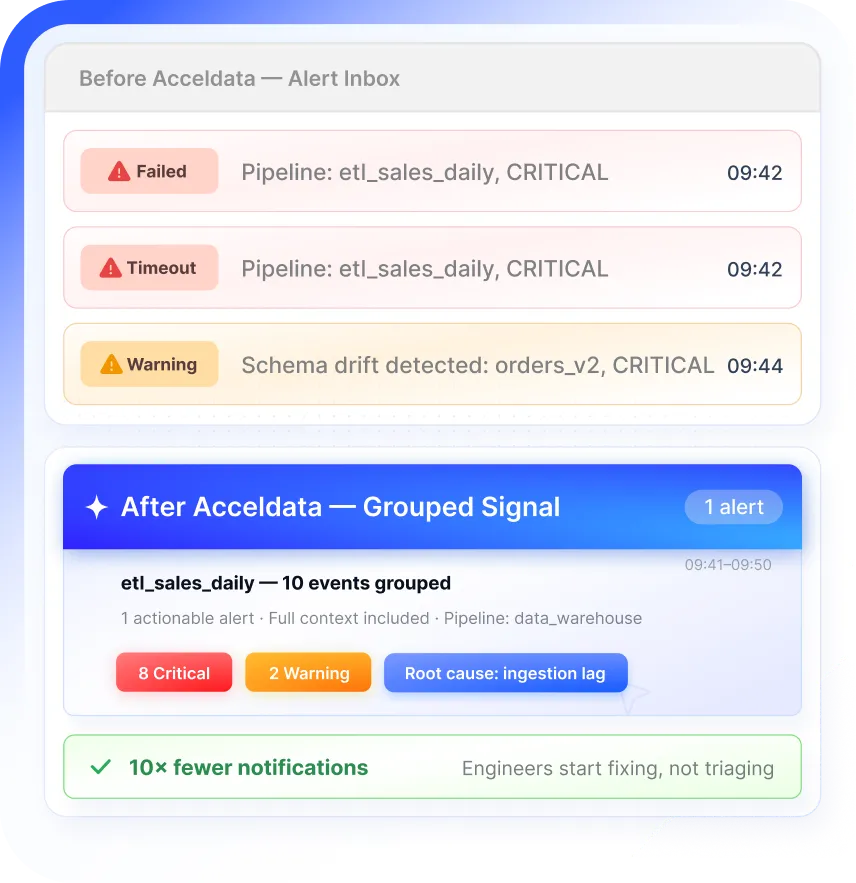
Cut Alert Noise. Resolve Data Incidents Faster.
Acceldata's intelligent alerts and notifications system surfaces only what demands attention, delivering full context at the point of alert, and cutting the time from detection to resolution.
Request a demo

TRUSTED BY ENTERPRISE DATA TEAMS WORLDWIDE


- One media streaming provider replaced 10 separate alert pings per failing pipeline with a single grouped alert.
- Engineers opened one notification and understood the full scope immediately.
- They started fixing immediately — instead of triaging ten near-identical tickets.
Fewer alerts. More signal. Faster decisions.

Stop Treating Every Alert the Same
Most monitoring tools fire an alert for every anomaly, every policy breach, every threshold crossed. The result: alert fatigue so severe that engineers start ignoring the inbox entirely.
Acceldata groups related alerts by asset, pipeline, or schema — collapsing redundant noise into single, actionable signals.
Understand Any Alert in Seconds — Without Tab-Switching
Once an alert fires, the real time sink begins: opening five tools, hunting for lineage documentation, reconstructing context manually.


Real outcome: A retail chain identified the exact table and transform causing a data freshness delay — inside the alert view, without opening a single additional tool. Time from alert to root cause: minutes, not hours.
Route the Right Alerts to the Right People
Acceldata's configurable subscription reports let you build routing logic that matches how your team actually operates
Alert Type
Delivery
Recipient
HIGH
Pipeline failure
Immediate
PagerDuty + Slack
On-call engineer
Team lead CC'd
MEDIUM
Pipeline failure
Within 1 Hour
Email + Slack
Owning team
Domain DL
LOW
Pipeline failure
Daily Digest
Email summary
All subscribers
Batched 6am
See the Blast Radius Before You Start Remediating
One broken pipeline rarely breaks just one thing. Acceldata's impact analysis maps the direct blast radius of every incident the moment it triggers.
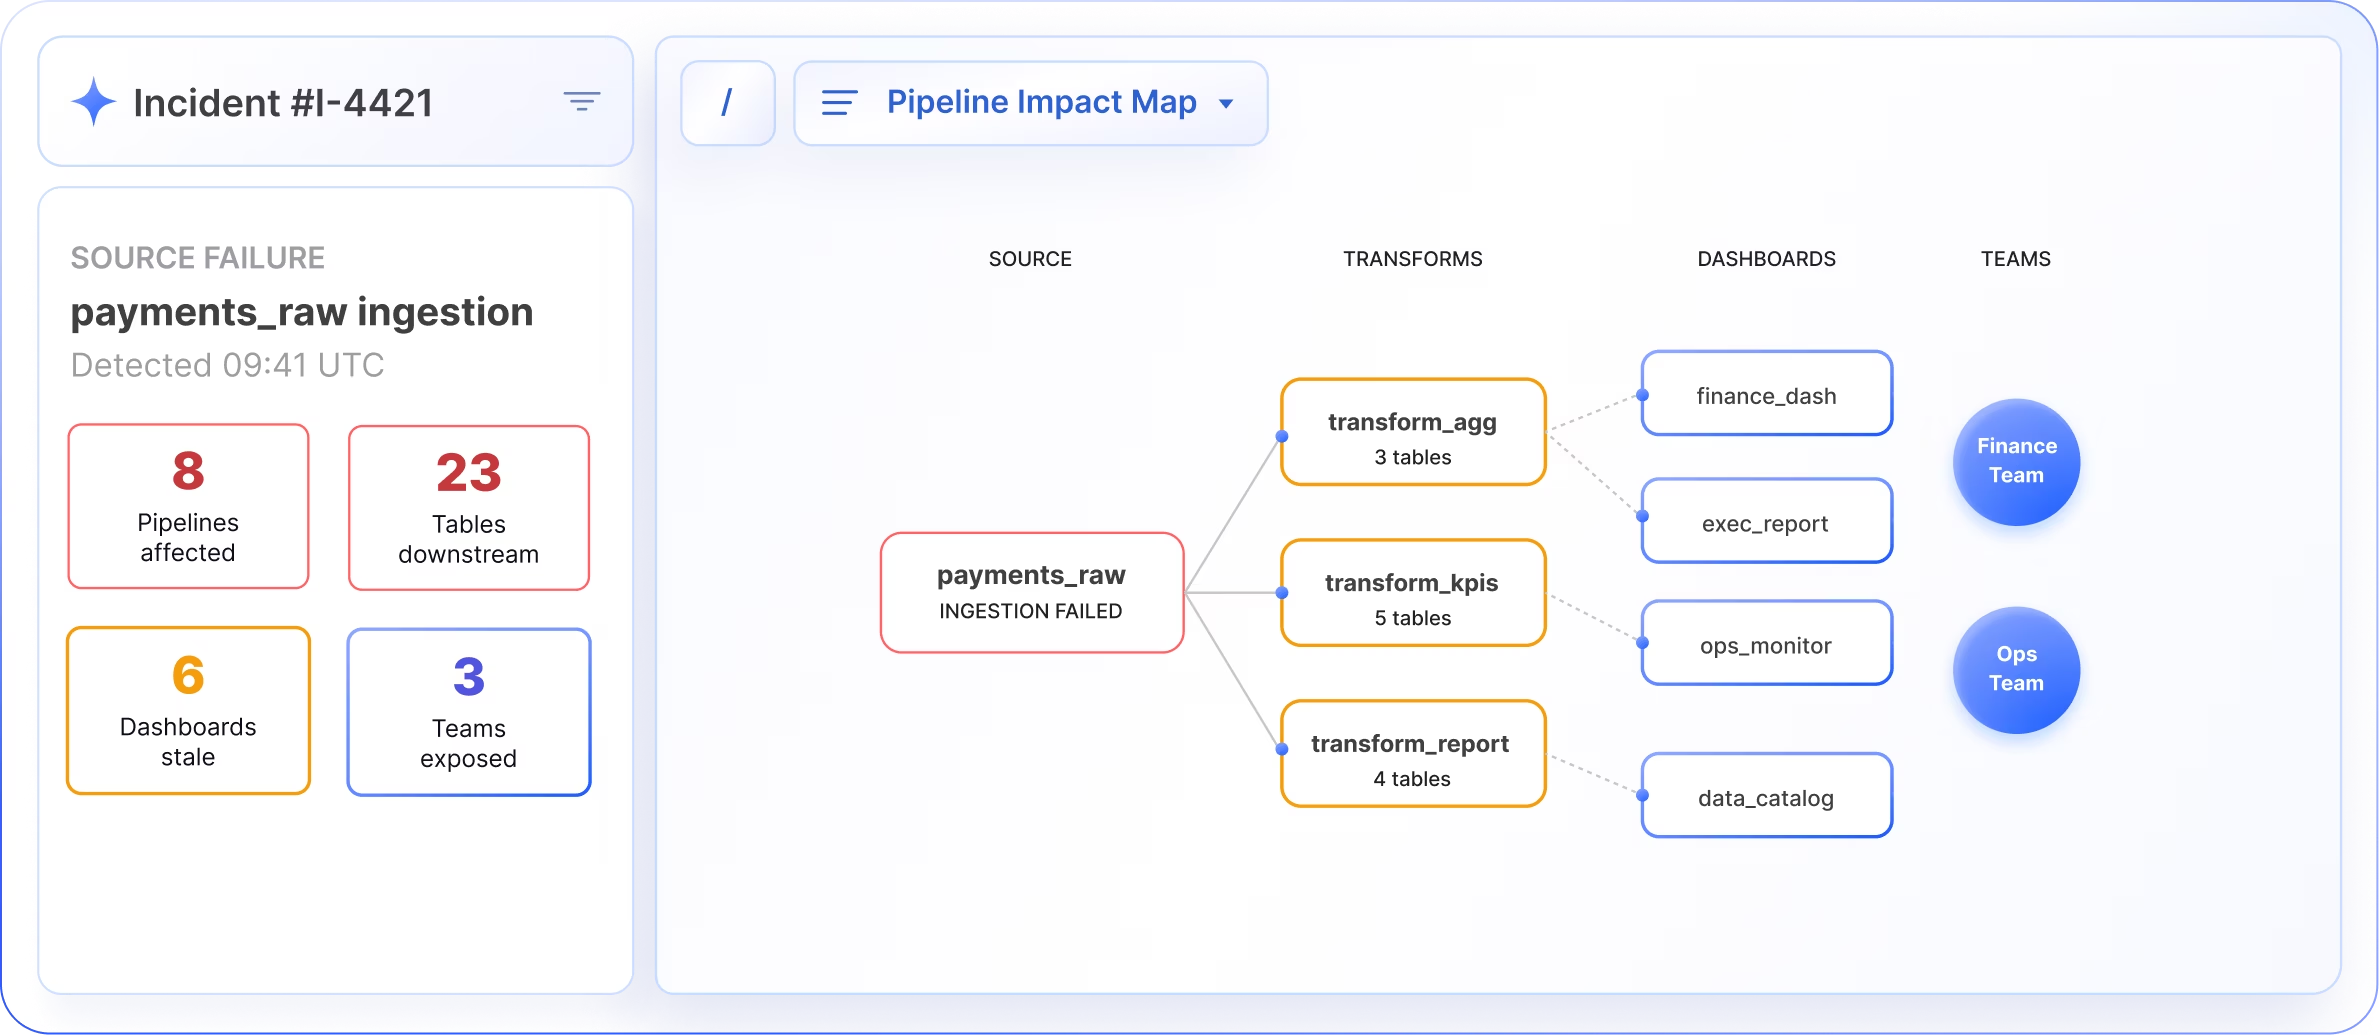
Reduce MTTR — Not by Working Faster, But by Guessing Less
Engineers spend the majority of incident time reconstructing context — what failed, why it failed, what else it touched, and what to do next. Acceldata compresses that phase to near-zero.

Correlated Alerts
Correlated alerts show related failures across assets so you see patterns, not isolated events

Root-Cause Context
Root-cause context surfaces the originating failure in the pipeline chain

Recommended actions
Recommended actions give engineers a starting point, not a blank page
The outcome is measurable: reduction in alerts summarized per tenant and decrease in MTTR are the primary success metrics tracked across Acceldata's subscription reports rollout.
Built for Teams Running Complex Data Pipelines at Scale
If your team is:

Managing pipelines across multiple clouds, warehouses, or orchestration tools

Struggling to prioritize incidents without knowing their downstream impact
Spending more time reconstructing context than actually fixing problems
Getting escalations from business users before internal monitoring catches the issue
Ready to get started
Explore all the ways to experience Acceldata for yourself.

Detect Data Anomalies Before They Breach Your SLOs
Most systems alert you after something breaks. Acceldata surfaces deviations as they emerge — across metrics, pipelines, and raw data — so your team can act before impact.
Request a demo

TRUSTED BY ENTERPRISE DATA TEAMS WORLDWIDE
Rule-based tools were built for infrastructure. Data breaks differently.

Unknown-Unknowns Hit Business Decisions
Subtle multi-column anomalies — a changed logging format, a misreporting inventory system, a stale data feed — slip past every univariate check and silently corrupt the downstream decisions that depend on them.
Context-Blind Thresholds
A 12% volume drop Tuesday after a holiday is normal. The same drop Wednesday mid-quarter close is a P1. Rules don't know the difference.
Query Any Source. Govern at the Query Layer. Own Your Compute.
XDP's federated query engine runs on Trino — extended with native governance, unified catalog integration, and customer-controlled Kubernetes execution.
No proprietary formats.
No forced cloud dependency.
No bolt-on governance tools.
One SQL statement.
Multiple heterogeneous catalogs.
Zero data movement required.
Zero Configuration
Three Steps to Detection. No Manual Threshold Tuning.
Most ML-based monitoring tools shift the burden from writing alert rules to writing training pipelines. Acceldata eliminates both.
1


Select Tables or Pipeline Metrics

Point Acceldata at the tables or pipeline metrics you want to monitor. No agent installation, no SDK changes.
2
Choose Your Detection Model
Time-series, multivariate, or both. Select the detection mode that matches your pipeline's risk profile.
3
Set Sensitivity Level
One slider. Low, medium, or high sensitivity. Acceldata handles the rest — including recalibration after schema changes.
Two Detection Modes. Full-Spectrum Coverage
Two complementary detection modes — covering the shape of your pipeline metrics over time and the multivariate relationships inside your data.

Metric-based
Anomaly Detection
Monitor how your data behaves over time
- Detect changes in freshness, volume, and data distribution
- Identify shifts in data "shape" across columns and datasets
- Surface anomalies in metrics like distinct values, averages, and variance
EXAMPLE
Missing regions, delayed pipelines, or unexpected spikes — flagged instantly.

Multivariate
Anomaly Detection
Find hidden issues inside your data
- Analyze full datasets across multiple correlated fields
- Detect anomalous rows and segments — even when rules pass
- Reveal patterns humans didn't anticipate
Customer Example
Global Retailer
Uses multivariate anomaly detection on shipping data. When the system flags an anomalous pattern, a notification reaches the business user directly — who decides in context whether it's normal variation or something that needs a new policy. No engineer in the loop for triage.
What This Means For Your Team

For Data Engineers
Stop chasing false positives — focus on real anomalies with context.

For SREs
Detect early signals before incidents escalate.

For Data Leaders
Reduce MTTD and MTTR while improving data reliability across the organization.
Ready to get started
Explore all the ways to experience Acceldata for yourself.